Quick Summary:
The inventory turnover ratio shows how often stock moves out of the business and gets replaced within a set period. It helps you understand if the stock is moving at the right pace, sitting too long, or running out too quickly.
You'll walk away knowing the following:
- Understand what the inventory turnover ratio is and how it affects business performance.
- Use the inventory turnover formula correctly with COGS and average inventory.
- How to record and manage these transactions properly.
- Read high and low-turnover results with more context.
- Improve inventory turnover with better data, purchasing and reporting.
Many businesses lose money because stock decisions are made too late. Overstocking, understocking, poor demand planning, and delayed purchase reviews can all tie up cash and reduce margins.
The inventory turnover ratio helps you catch these issues with a simple number. It connects stock, sales and cost in a way that business owners can use for buying, replenishment and cash flow decisions.
If a business uses separate POS software, inventory, and accounting tools, this ratio can become harder to trust. Stock performance becomes clearer when billing, purchases, inventory and reports work from one system.
What is the Inventory Turnover Ratio?
The inventory turnover ratio (ITR) measures how many times a business sells and replaces its average stock within a given period.
For example, a ratio of 5 means the business sold and replaced its average stock five times during the year.
This number helps you check if the stock is moving at a healthy pace. It can point to overbuying, slow-moving items, dead stock, expiry pressure, seasonal demand changes, or stock sitting unevenly across different locations.
Why is Inventory Turn Over Ratio Important?
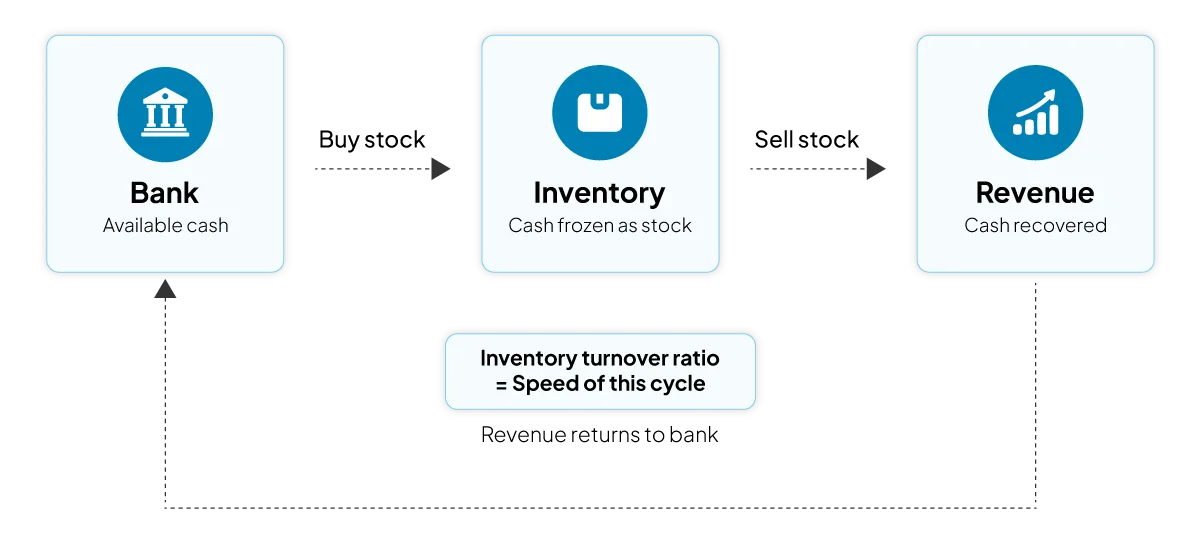
ITR is important because inventory uses cash before it creates revenue. Every item on a shelf, in a warehouse or in production has already taken money out of the business.
A strong inventory turnover ratio can help you:
- Reduce the capital blocked in unsold stock
- Identify slow-moving products earlier
- Improve purchase planning and branch-wise allocation
- Reduce storage, expiry, damage and markdown losses
Stock planning also has to account for supplier delays, price-sensitive customers, demand shifts and operational disruptions. If stock records are weak, these issues become harder to manage.
Inventory Turnover Ratio Formula With Breakdown
The inventory turnover formula is simple:
This calculation is also referred to as the stock turnover formula or the inventory ratio formula. Some businesses use sales instead of COGS, but COGS gives a cleaner result because it compares stock at cost value with stock sold at cost value.
The Standard Inventory Turnover Formula
Here’s how to calculate the inventory turnover ratio using the inventory ratio formula:
| Figure | Amount |
|---|---|
| COGS |
R900,000 |
|
Average Inventory |
R150,000 |
|
Inventory Turnover |
6 times |
The stock turned over six times during the year.
What is COGS (Cost of Goods Sold)?
COGS shows what the sold stock cost the business during that period. It is not the selling price.
| Figure | Amount |
|---|---|
|
Opening Inventory |
R80,000 |
|
Purchases |
R500,000 |
|
Closing Inventory |
R100,000 |
|
COGS |
R480,000 |
This R480,000 figure can be used in the inventory turnover formula.
What is Average Inventory?
Average inventory gives a basic view of the stock value held during the period.
| Figure | Amount |
|---|---|
|
Opening Inventory |
R120,000 |
|
Closing Inventory |
R180,000 |
|
Average Inventory |
R150,000 |
If stock levels rise and fall often, it may be better to use monthly inventory values instead of only opening and closing stock.
Step-by-Step Calculation Example
Here is a simple yearly calculation for a South African retail business.
| Figure | Amount |
|---|---|
|
Opening Inventory |
R200,000 |
|
Purchases |
R850,000 |
|
Closing Inventory |
R250,000 |
|
COGS |
R800,000 |
|
Average Inventory |
R225,000 |
|
Inventory Turnover Ratio |
3.56 times |
The business sold and replaced its average inventory about 3.56 times during the year.
How to Read High and Low Inventory Turnover
A high or low inventory turnover ratio is not automatically good or bad. The result needs to be read with your business model, product type, supplier timelines and profit margins.
The same number may not point to the same issue for every type of business. A good ITR depends on how quickly goods should move and how much stock the business needs to keep demand covered.
High ITR: When It’s Good and When It’s a Red Flag
A high ITR usually means products are selling quickly. This can be a good sign when demand is strong and replenishment is planned well.
But a very high ratio can also be a warning sign. If stock levels are too low, the business may be losing sales because customers cannot find what they need.
A high ITR can be a red flag when:
- Best-selling items often go out of stock
- Branches need frequent emergency transfers
- Customers switch to competitors
- Sales are limited by stock availability
The goal is to keep enough stock to serve demand without overbuying.
Low ITR: Common Causes and Business Risks
A low inventory turnover ratio means stock is moving slowly. Common causes include:
- Overstocking or seasonal stock bought too early
- Poor sales forecasting and weak promotions
- Expired, outdated or slow-moving products
- Incorrect stock records or poor branch-wise allocation
How to Judge a Good Inventory Turnover Ratio
There is no fixed turnover number that works for every business type. As a general guide:
| Business Type | Typical Turnover Pattern |
|---|---|
|
Grocery and FMCG |
Higher turnover because items sell often |
|
Clothing and Footwear |
Medium turnover with seasonal peaks |
|
Electronics |
Lower turnover due to higher item value |
|
Furniture |
Lower turnover due to longer buying cycles |
|
Manufacturing |
Depends on raw material, production cycle and finished goods demand |
|
Wholesale and Distribution |
Varies by product category and customer order frequency |
Compare your ratio against previous periods, similar stores or branches, product categories and supplier lead times.
Tip: Track ITR by category and SKU. A store-level number can hide slow movers and stockout risks.
Inventory Turnover, Dead Stock and Slow Movers
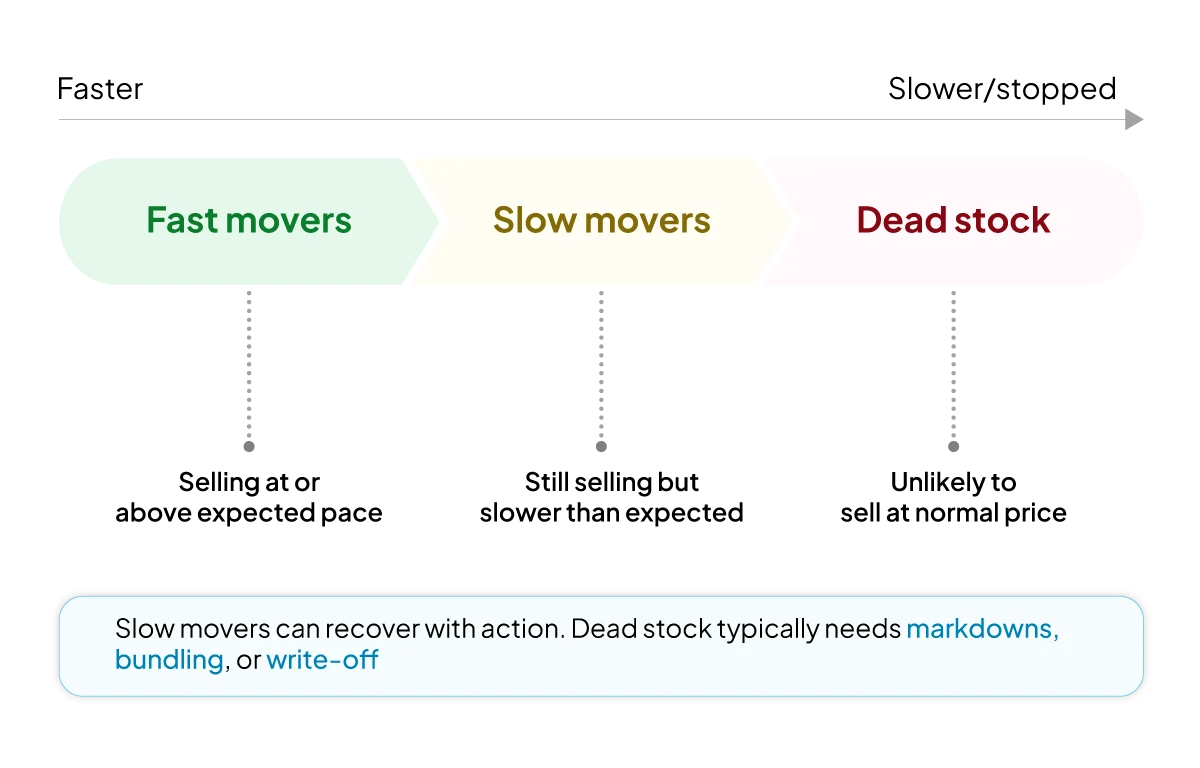
Dead stock is inventory that is unlikely to sell at normal prices. Slow movers are products that still sell but much more slowly than expected. Common reasons for dead stock and slow movers include:
- Poor demand planning or weak category review
- Old seasonal stock, expiryissuesor batch issues
- Supplier minimum order quantities that are too high
- Damaged packaging, product changes or poor location-wise allocation.
Interesting Fact: Global retail inventory distortion, which includes out-of-stocks and overstocks, was estimated at about $1.73 trillion annually in 2025. That shows how costly poor stock balance can become at scale.
Source:IHL Services
Related Inventory Metrics You Should Track
The inventory turnover ratio gives you a strong starting point, but it should be read with other inventory metrics.
1. Days Sales of Inventory
Days Sales of Inventory, or DSI, shows how many days it takes to sell your average inventory.
DSI = Average Inventory ÷ COGS × 365
A lower DSI means stock sells faster. A higher DSI means inventory stays in the business for longer.
2. Sell-Through Rate
The sell-through rate shows how much received stock was sold during a specific period.
Sell-Through Rate = Units Sold ÷ Units Received × 100
This is useful for promotions, new product launches and seasonal items.
3. GMROI
GMROI (Gross Margin Return on Inventory Investment) shows how much gross profit your business earns for every rand invested in inventory.
GMROI = Gross Profit ÷ Average Inventory Cost
This helps you see if a product is only moving fast or actually giving you a good return.
4. Stockout Rate
The stockout rate shows how often products are unavailable when customers want to buy them.
Stockout Rate = Stockout Incidents ÷ Total Demand Opportunities × 100
Together, these metrics help you avoid holding too much stock and cutting inventory so low that customers cannot buy what they need.
How to Improve Your Inventory Turnover Ratio
You need to know what is selling, what is sitting and what needs to be reordered before the business loses sales.
Start with these steps:
- Review sales and stock reports regularly.
- Set reorder levels for fast-moving products and reduce repeat purchases for slow movers.
- Track expiry dates, batch movement and supplier lead times.
- Keep POS, inventory, purchases and accounting data connected.
Pro Tip: Review your top-selling and slowest-moving SKUs every month.
Real-World Examples of Inventory Turnover Calculation
Here are two simple examples using South African Rand.
1. Example for a Retail Store
| Figure | Amount |
|---|---|
|
Opening Inventory |
R300,000 |
|
Purchases |
R900,000 |
|
Closing Inventory |
R400,000 |
|
COGS |
R800,000 |
|
Average Inventory |
R350,000 |
|
Inventory Turnover Ratio |
2.29 times |
The store moved through its average stock about 2.29 times during the year.
This result should be checked against slow-moving categories, old stock, discount dependency and products with weak sell-through. It may also show that too much cash is tied up in stock that only moves during promotions.
2. Example for a Manufacturing Business
| Figure | Amount |
|---|---|
|
Opening Inventory |
R500,000 |
|
Purchases and Production Costs |
R1,700,000 |
|
Closing Inventory |
R600,000 |
|
COGS |
R1,600,000 |
|
Average Inventory |
R550,000 |
|
Inventory Turnover Ratio |
2.91 times |
The business moved through its average inventory about 2.91 times during the year.
Common Mistakes Businesses Make With Inventory Turnover
The inventory turnover ratio is simple to calculate, but it is easy to misread. Watch out for these common mistakes:
- Using Sales Instead of COGS: Sales include markup. COGS gives a cleaner view because it reflects the cost value of stock sold
- Using Incorrect Opening or Closing Inventory: If stock counts are delayed, returns are missed, or branch transfers are not updated, the final ratio will not be reliable
- Ignoring Returns and Discounting: Heavy discounts may improve turnover, but they can reduce margins
- Treating All SKUs the Same: Fast-moving items may make the overall ratio look fine while slow movers continue to build up
How VasyERP Helps You Improve Inventory Turnover
The inventory turnover ratio only helps when your data is accurate, current and easy to act on. VasyERP brings POS billing, inventory management, purchases, accounting, CRM, reporting and multi-location operations into one connected system.
For inventory turnover, VasyERP can support your team with:
- Real-time stock tracking, low-stock alerts and stock ageing reports
- Batch and expiry tracking for better control over time-sensitive inventory
- Multi-location stock visibility to support transfers before new purchases
- Purchase automation, central reporting and offline POS support
When your team can see what is moving, what is stuck and what needs replenishment, the inventory turnover ratio becomes a working business tool rather than a number reviewed too late.
FAQs About Inventory Turnover Ratio
A good inventory turnover ratio depends on your industry, product type, supplier lead time, margin, and customer demand. Compare your ratio with previous periods, similar product categories, and branch-level performance to assess whether it is healthy.
Not always. A higher inventory turnover ratio can indicate strong sales, but it may also suggest that stock levels are too low, increasing the risk of stock-outs and missed sales opportunities.
At a minimum, every inventory-based business should calculate its inventory turnover ratio annually and compare the results with previous periods. More frequent reviews can provide better operational insights.
Yes. Faster stock movement helps businesses recover cash sooner. Slow inventory turnover can tie up cash in unsold stock, increase storage costs, and create pressure to discount products.
Yes. ERP software provides the visibility needed to make better purchasing, replenishment, and inventory movement decisions, helping businesses improve inventory turnover over time.
Last Updated on June 28, 2026